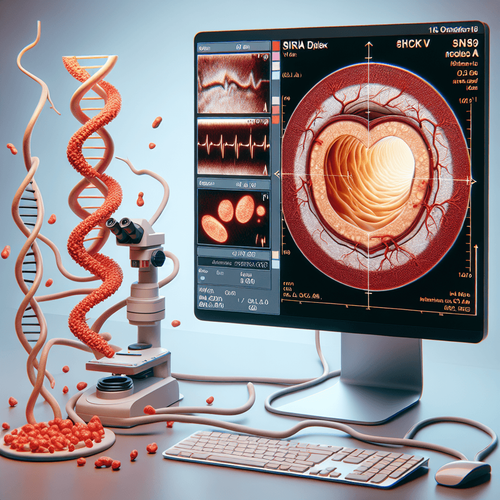
Automating intravascular ultrasound processing for Coronary Artery Disease and, specifically, congenital and acquired Coronary Artery Anomalies promises to standardize measurements that matter. A single platform that reproducibly identifies lumen boundaries, ostial geometry, and vessel dimensions can reduce inter-operator variability and improve the clarity of reports that guide revascularization strategies. For anomalies where the course, take-off angle, and ostial morphology drive risk and intervention decisions, reproducibility is not a luxury; it is a requirement.
The AIVUS-CAA software, described on PubMed, focuses on repeatable, structured outputs for Intravascular Ultrasound that clinicians can act on. This article unpacks what automated IVUS quantification could deliver, where it fits in contemporary cath lab decision-making, and what governance, validation, and workflow steps are needed to translate the technology into routine practice.
Automating IVUS for coronary artery anomalies
Coronary artery anomalies are heterogeneous, spanning anomalous origin, interarterial courses, intramural segments, slit-like ostia, and acquired post-surgical or post-interventional configurations. Each phenotype carries different risks and intervention thresholds, and many require fine-grained intraluminal detail to inform care. Intravascular Ultrasound offers that detail, but manual interpretation remains variable, time-consuming, and difficult to standardize across operators and centers. An automated pipeline that pre-populates lumen and external elastic membrane contours, detects ostial morphology, and quantifies geometric features could raise the floor on measurement quality while freeing clinicians to focus on decisions rather than delineations.
Clinical context and unmet need
In the cath lab, operators often face a dual challenge: confirm the presence and mechanism of an anomaly and determine whether to proceed with Percutaneous Coronary Intervention, recommend surgical correction, or continue conservative surveillance. Decisions hinge on lumen area minima, ostial shape, vessel angulation, and the relation of the intramural segment to the aortic wall. Manual tracing can vary, and the descriptors used in reports are not always consistent between centers. Automating boundary detection and generating standardized measurements offers a way to align language, reduce subjective calls, and enable more consistent comparisons over time for the same patient.
For congenital variants with an interarterial course or a slit-like ostium, very small differences in ostial area and take-off angle can affect flow limitations under stress. When anomalies coexist with atherosclerosis, the need to differentiate fixed lesion severity from dynamic compression makes the role of precise intraluminal imaging even more central. By organizing outputs into a consistent template, automation can help clinicians synthesize geometry with physiology, including data from Fractional Flow Reserve, without losing time to manual measurement. Ultimately, standardization is about making the right thing easy to do under procedural pressure.
Imaging features IVUS can quantify in anomalies
Several features define a clinically robust IVUS assessment of anomalies. These include minimal luminal area and diameter at the ostium and along the suspected intramural segment, eccentricity indices, and the presence of slit-like or elliptical shapes. The orientation of the long axis of the lumen, relative to the course of the proximal vessel, informs whether dynamic compression is plausible. Wall architecture, including the appearance of the external elastic membrane and surrounding tissue interfaces, adds context on whether the segment is intramural versus extramural. Automated quantification can render these features consistently, even under suboptimal image quality, provided the algorithms address noise, catheter eccentricity, and artifact.
Standardized outputs also facilitate comparisons with noninvasive modalities such as coronary CT angiography for anatomical course and with invasive physiology for functional significance. When IVUS measurements are reproducible and enumerated in a consistent report, they can be combined with perfusion imaging or stress testing data to support comprehensive multi-modality decision-making. Beyond single-patient care, aligned quantification enables registries to aggregate like-with-like, improving signal-to-noise for outcomes analyses that have historically been sparse in this rare but clinically meaningful domain.
What standardized IVUS outputs can deliver
The AIVUS-CAA approach focuses on reproducible measurement and documentation. While operators have long relied on manual pullbacks and screenshots to describe ostia and proximal segments, automated processing can generate full-length contour sets, cross-sectional morphometrics, and longitudinal plots in one workflow. When packaged in a structured report with clear definitions, these data can support procedural planning and post-procedural surveillance. Automating the tedious parts also reduces cognitive load and may shorten the path from imaging to action for time-sensitive decisions.
Pipeline components and standard outputs
Automated IVUS analysis typically begins with frame selection, quality control, and catheter position estimation. Advanced Image Segmentation models delineate the lumen and external elastic membrane, while contour post-processing stabilizes frames against noise and motion. The system then computes morphometrics such as minimal luminal area, mean diameter, area stenosis relative to reference segments, eccentricity, and ostial shapes. When focused on anomalies, specialized detectors identify take-off angles, ostial geometry, and evidence of intramural segments, summarizing each in a predefined, standardized vocabulary.
Because vessel orientation and shape change along the course of the coronary tree, frame-to-frame registration is central to trustworthy reporting. Registration allows consistent labeling of the ostium, intramural portion, and extramural reference locations so that measurements reflect anatomy rather than frame order. Advanced methods can also flag frames with inadequate border confidence, prompting operators to review or repeat acquisitions. The result is a report that foregrounds high-confidence measurements while transparently indicating uncertainty where it exists, rather than burying it in free text.
Validation, interpretability, and safety signals
Automated quantification must earn trust through transparent validation against expert tracings and inter-reader reproducibility. It is critical to demonstrate that boundary detection is consistent across vendors, catheter frequencies, and common artifacts such as blood speckle or guidewire shadowing. Confidence maps and quality flags help operators contextualize outputs and decide when to rely on the automation versus override it. In parallel, well-defined failure modes, such as performance degradation in heavy calcification or ostial foreshortening, should be documented up front.
Interpretability is not optional in high-stakes procedural decision-making. Overlaying predicted contours on the original IVUS frames and exposing the sequence of processing steps allows clinicians to audit the output in real time. Beyond contour overlays, standardized definitions for measurements, with clear visual exemplars, make it easier for teams to discuss edge cases consistently. Finally, a safety-first posture includes embedding guardrails that prevent off-label extrapolations, such as using anomaly-focused models for complex atherosclerotic lesions without appropriate calibration, until evidence supports such use.
From lab to bedside: workflow, governance, and next steps
To deliver value, automation has to fit into cath lab workflows with minimal friction. That means the software should accept standard IVUS DICOM data, process pullbacks rapidly, and output a one-page summary with drill-down capability for complex cases. It should integrate with reporting systems to reduce double documentation and preserve traceability. When anomaly phenotyping guides whether to stent, refer for surgery, or monitor, having a timely, standardized report supports predictable decision pathways and reduces unwarranted variation across operators and institutions.
Workflow integration and governance
Implementation requires more than deployment on a workstation. Institutions should establish governance for image processing tools, including version control, user training, and a standardized glossary. Align the automated measurements with clinical pathways so that ostial area thresholds or eccentricity metrics map to predefined action statements. Where applicable, link outputs to Clinical Decision Support prompts in the report, such as suggestions to obtain physiology when geometry is borderline or to consider surgical evaluation if features consistent with an intramural interarterial course are present.
Data stewardship is equally important. Local quality teams can monitor concordance between automated and expert measurements and track downstream decisions to detect drift or bias. These feedback loops also support continuous improvement and facilitate audit for accreditation. Because anomaly cases are relatively infrequent at single centers, federated or multi-institutional registries that accept standardized outputs will be key to benchmarking and accelerating learning while protecting patient privacy.
Use cases across the care continuum
In pre-procedural planning, anomaly quantification clarifies whether a slit-like ostium is hemodynamically relevant, whether stent sizing is feasible, and whether an intramural path risks dynamic compression. During procedures, automated measurements can confirm that the ostial geometry has been modified adequately by stenting or that further optimization is unnecessary. In post-procedural care, consistent measurements facilitate longitudinal surveillance, making it easier to detect changes that warrant reassessment. For multidisciplinary conferences, standardized visuals accelerate consensus building and documentation.
Beyond the cath lab, anomaly-focused IVUS outputs inform surgical discussions about unroofing, reimplantation, or bypass. Linking standardized morphometrics to outcomes over time may refine criteria for selecting between interventions, especially in borderline cases. For example, concordance between geometric severity and physiology measured by Fractional Flow Reserve can enrich shared decision-making when symptoms are intermittent and stress test results are equivocal. For patients, clearer reports and consistent measurements simplify communication and support more transparent, informed consent.
Where atherosclerosis intersects anomalies, careful distinction between fixed plaque-related narrowing and anomaly-driven geometry matters. Automated quantification that separately reports plaque burden and anomaly morphology can help avoid over- or under-treatment. When plaque dominates, integration with lesion preparation and stent optimization pathways is straightforward. When anomaly-driven compression is primary, geometry-first decision-making may steer care toward conservative management or surgical consultation.
Technical foundations and future directions
At the algorithmic level, advances in Machine Learning and Computer Vision make robust segmentation and artifact handling increasingly feasible. Architectures that combine spatial attention with temporal smoothing across frames can improve contour stability, while uncertainty estimation flags low-confidence outputs for operator review. Domain adaptation methods can narrow performance gaps between different IVUS systems and acquisition protocols. To support generalizability, training datasets should reflect the spectrum of anomaly phenotypes, vessel sizes, and imaging conditions encountered in practice.
Standardization extends beyond code. A shared ontology for anomaly descriptors, measurement definitions, and reference locations allows cross-center comparability. Open benchmarks and clearly specified test sets enable fair evaluation and encourage iterative improvement. As models mature, there is room to explore composite risk indices that integrate geometry with physiology and symptoms, but such indices must be transparent and anchored in clinically interpretable components.
Interventional and surgical decision points
Automated reports should be engineered around the decisions they inform. In intervention-first pathways, they can guide device selection, ostial preparation, and stent sizing, helping avoid underexpansion or geographic miss. For surgery-first considerations, reproducible measurements of ostial area and intramural length, combined with course classification, support referral to teams experienced in unroofing or reimplantation. When myocardial ischemia is suspected but geometry is borderline, the report can prompt physiologic testing before a definitive intervention.
Decision-making should also consider patient-specific factors such as age, activity level, comorbidities, and concomitant lesions. As standardized data accumulate, signal detection for which phenotypes respond best to Coronary Artery Bypass Grafting versus PCI versus conservative management will sharpen. The more consistently measurements are captured and reported, the more credible these phenotype-treatment associations will be, with the potential to reduce unwarranted variability in care.
Quality measurement and learning health systems
Automated quantification can feed structured dashboards that track process and outcome measures over time. This supports Quality Improvement initiatives focused on measurement reproducibility, time-to-report, and alignment between imaging and chosen interventions. In a learning health system, standardized anomaly metrics collected at scale enable better case-mix adjustment and more meaningful comparison of outcomes across centers. For rare or complex anomalies, this aggregation is essential to reach statistical power and identify practice patterns that improve patient-reported outcomes.
Standardized data also facilitate external reporting and accreditation. Centers can demonstrate adherence to defined imaging standards, including the proportion of anomaly cases with complete morphometric reporting and the rate of manual overrides due to low-confidence frames. These indicators create a feedback loop that strengthens both the technology and the clinical processes around it, improving reliability for patients and clinicians alike.
Evidence translation and regulatory considerations
Translation into practice depends on clear demonstration of clinical utility, not just technical accuracy. Evidence that standardized IVUS outputs change decisions in a beneficial way, reduce procedural times, or improve patient-centered outcomes will matter to clinicians, payers, and regulators. Careful prospective evaluation across diverse settings is needed, with transparent reporting of inclusion criteria, imaging acquisition protocols, and endpoints. Post-market surveillance should monitor performance drift, especially as software updates and new hardware enter the ecosystem.
Interoperability with existing systems reduces the burden of adoption. Support for standard DICOM formats and integration with reporting software and electronic health records will lower friction. Training, simulation, and competency assessment modules can accelerate uptake, particularly in centers with variable exposure to anomaly cases. Finally, attention to data privacy, audit trails, and secure model update processes ensures that the benefits of automation do not come at the expense of patient trust or institutional risk.
Closing perspective
Automated IVUS processing tailored to coronary artery anomalies is a logical next step in modernizing intraluminal imaging. By converting images into consistent, actionable measurements, it can align teams, support decisions, and power cumulative learning across institutions. The promise is pragmatic: less variability, faster synthesis, and more comparable longitudinal follow-up. Realizing that promise will require multi-center validation, thoughtful workflow design, and governance that keeps clinicians in the loop and patients at the center of decision-making.
As implementations mature, the field should prioritize transparent performance reporting, user-centered interfaces, and outcomes-focused research. With these guardrails, standardized IVUS outputs can become a reliable partner in the care of patients with coronary artery anomalies, complementing physiology, noninvasive imaging, and clinical judgment to improve safety and outcomes. For now, the trajectory is clear: automation that is interpretable, clinically aligned, and evidence-backed stands the best chance of delivering durable value.
For details on the AIVUS-CAA platform and its initial description, see the PubMed record: https://pubmed.ncbi.nlm.nih.gov/40972478/. As further evidence accumulates, expect standardized IVUS quantification to shape not only individual care pathways but also the evidence base that defines best practices in this nuanced area of cardiology.
LSF-8643877273 | November 2025
How to cite this article
Team E. Automated ivus for coronary artery anomalies and standardization. The Life Science Feed. Published November 15, 2025. Updated November 15, 2025. Accessed March 17, 2026. https://thelifesciencefeed.com/cardiology/coronary-artery-disease/innovation/automated-ivus-for-coronary-artery-anomalies-and-standardization.
Copyright and license
© 2026 The Life Science Feed. All rights reserved. Unless otherwise indicated, all content is the property of The Life Science Feed and may not be reproduced, distributed, or transmitted in any form or by any means without prior written permission.
Fact-Checking & AI Transparency
This content was produced with the assistance of AI technology and has been rigorously reviewed and verified by our human editorial team to ensure accuracy and clinical relevance.
References
- Automated intravascular ultrasound image processing and quantification of coronary artery anomalies: The AIVUS-CAA software. https://pubmed.ncbi.nlm.nih.gov/40972478/.
Related Articles